3.1 First steps
Display an image
The following script loads the data of one FITS image, and displays the image. It must be saved in a ”.py” file:
# -*- coding: iso_8859_1 -*-
from aspylib import astro

#------ inputs ------
Folder = u"C:\\Images\\Jérôme\\"
Imagelist = [Folder + "Image-calibrated-1.fit"]

#--- loads and displays image ---
data = astro.get_imagedata(Imagelist)
astro.display(data)

raw_input()
Except for the first line, all lines starting with “#” are comments and are ignored by the Python interpreter.
The first and last lines will be used in most Python scripts :
- the first line is required to specify the text file encoding.
- the last statement “raw_input()” is necessary to prevent the script to close immediately after having been executed
The statement “from aspylib import astro” is needed to import the “astro” module from AsPyLib. Each time a function of this module is called, its name must take the form: astro.function().
Two other interesting things specific to the script:
- the string called Folder as a “u” in front of it to tell Python that it is a Unicode string. The Unicode encoding is required if the path contains non-ASCII characters (the é and ô) so that it is handled properly.
- the function astro.get_imagedata() works with a list of images, so a list of image names must be provided to it. That’s the reason why we put the name of the single image into square brackets: we make a list with one element.
As you see, the image display is relatively simple. It is actually programmed with only 35 lignes of code, and makes use of the Matplotlib module. This is one aspect of AsPyLib : in more traditional softwares, a large part of the programming effort is spent to deal with Windows objects : windows, menus, buttons, etc. In AsPyLib the internal code is kept simple, and 100% of the efforts is spent on the image processing operations.
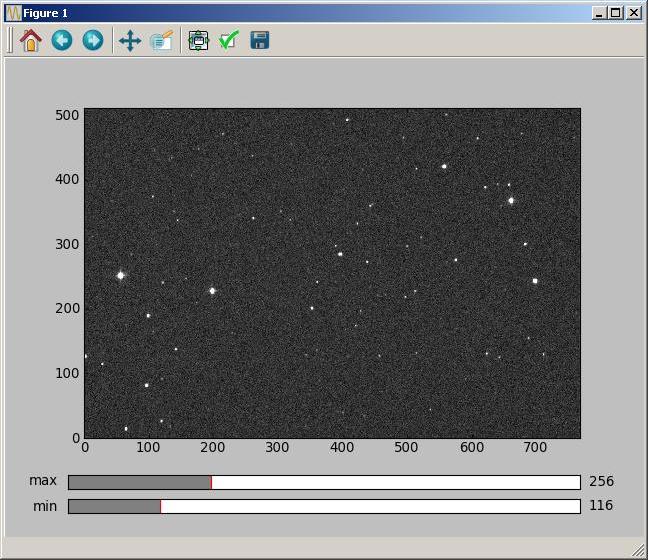
The navigation buttons are very powerful to zoom in, navigate back, and the sliders allow to ajust the thresholds for visualisation. In order to close automatically the image, the following statement must be inserted at the beginning: “import matplotlib.pyplot as plt”, and then the image is closed with the statement “plt.close()”.
Display the difference between two images
The code below illustrates the use of image lists:
# -*- coding: iso_8859_1 -*-
from aspylib import astro

#------ inputs ------
Folder = u"C:\\Images\\"
Imagelist = [Folder + "Image-calibrated-" + str(i+1) + ".fit" for i in range(2)]

#--- loads and displays image ---
data = astro.get_imagedata(Imagelist)
astro.display(data[1,:,:]-data[0,:,:])

raw_input()
The list Imagelist will contain: Imagelist = [“C:\Images\Image-calibrated-1.fit”, “C:\Images\Image-calibrated-2.fit”] The statement that is used to construct the list is called a “list comprehension”. See section 5.1.4 of this page for further details.
The data of both images are stored in a single Numpy array called “data”. The i-th image is contained in data[i-1,:,:]. We see that array indexing starts at 0, as in C langage.
Print statistics of an image list
# -*- coding: iso_8859_1 -*-
from aspylib import astro
import numpy as np

#------ inputs ------
Folder = u"C:\\Images\\"
Imagelist = [Folder + "Image-calibrated-" + str(i+1) + ".fit" for i in range(200)]

#--- loads and displays image ---
data = astro.get_imagedata(Imagelist)

for i in range(len(Imagelist)):
    print Imagelist[i],"min=", np.min(data[i,:,:].flatten()), \
    "mean=", np.mean(data[i,:,:].flatten()), "max=", np.max(data[i,:,:].flatten())

raw_input()
Be careful with the indentation before the “print” statement. Indentations play a central role in Python, and are part of the programming langage. They are used to identify blocks associated to keywords like if, for, while or def (def is used to define a function).
In this example, the numpy module is imported at the beginning of the script. It contains all the functions to perform mathematical operations on arrays of data. The import statement is in the form “import numpy as np” such that all numpy functions are called np.function().
- if the numpy module was imported with “import numpy” then all numpy functions must be called with “numpy.function()”
- if the numpy module was imported with the statement “from numpy import * ” then numpy functions must be called without the numpy. and np. prefixes, just by using function().
Print image information, with more elaborated image list
# -*- coding: iso_8859_1 -*-
from aspylib import astro

#------ inputs ------
Folder = u"C:\\Images\\"
Imagelist = [Folder + "Image-calibrated-" + str(i+1) + ".fit" for i in range(200) if (i+1)%2==0]

#--- loads and displays image ---
data = astro.get_imagedata(Imagelist)

for i in range(len(Imagelist)):
    median_values = astro.get_median(data[i,:,:])
    date_obs = astro.get_headervalues([Imagelist[i]], "DATE-OBS")
    print Imagelist[i]," DATE-OBS = ", date_obs[0], " median = ", median_values[0]

raw_input()
A slightly more elaborate list comprehension is used to define the list of images. Only the images called “Image-calibrated-i.fit” will be used, with i being even (i=2,4,6,8,10...).
Two other functions that are part of the “astro” module are used: - astro.get_median() calculates the median level of each image in the image list, from the Numpy array “data”, and returns a list with the median values. In our case, it returns a list with 100 elements. - astro.get_headervalues() returns in a list the values of the header DATE-OBS for each image in the list.