Attempt to measure (1036) Ganymed rotation axis
The following message was posted on AUDE-L Yahoo group (14 June 2011) by J.Caron, in French:
« The asteroid 1036 Ganymed looks like an interesting target for the coming months :it will pass close to Earth, at 0.360 AU in next October.It will also always stay at high declinations (from +10 to +65 deg) with a low magnitude (8 to 11). Besides, MPC is encouraging astrometry on it.
According to JPL Horizons, the rotation period is 10.31 hours which can be reasonnably measured while being not too fast. In the first part of its orbit (June-July) the motion is from 1.8 to 1.3 arcsec per minute in azimuth 30deg. Then in the second part (end of Sept, October, beginning Nov) the motion is from 2 to 3 arcsec per minute, in the opposite direction (azimuth 170 deg) !!
When we measure a rotation period with photometry, I think that the measurement also contains a contribution from the asteroid motion over the sky. The information that we are looking for is the inertial rotation period, while we are measuring the rotation with respect to the line of sight from Earth to asteroid. When we neglect the difference, we neglect the rotation of this line of sight in the inertial frame (which is exactly the asteroid motion over the sky).For 1036 Ganymed, if I am not wrong, the combination of a slow rotation (T=10.31h gives 0.6094 rad/h) and a large change of motion over the sky (+/-2 arcsec per minute gives +/- 0.0006 rad/h) gives a relative importance of 10^-3.
If all this is correct, and if the accuracies over the rotation periods derived by Raoul Behrend are realist (we often get better than 10^-5) we could try to measure the term linked to the asteroid motion. Then, taking the difference between the periods measured in June-July and October, we could determinate whether the rotation is prograde or retrograde.What do you think ?
If this is confirmed, it would be nice to involve a few people to do it (to be sure to have the right coverage in time due to weather, and to improve the measurements). »
The mathematics behind the method are described further in this document.
A few persones expressed their interest. The contributors are, in order of importance:
- Maurice Audejean (mpc B92)
- Jerome Caron (mpc C70)
- Francois Kugel (mpc A77)
- Emmanuel Conseil
After a few months the lightcurve of Ganymed was accurately measured. We could see a clear drift of the rotation period with time. Unfortunately it was not possible to obtain the rotation axis of Ganymed. Our results were suggesting a rotation period of 20.6h, but we received a confirmation from Marina Brozovic (NASA-JPL) who was observing Ganymed from Arecibo and Goldstone that Ganymed period was about 10 hours.
We suspect the reason for the above proposed model being not right is that it does not include Ganymed's phase. The fraction of the Ganymed disc which is illuminated changes with time and this also influences the apparent rotation period.
Results for the rotation period
Preliminary determination of rotation period has been done by Raoul Behrend with Courbrot software, see here.
| Measurement in | June-July 2011 | August 2011 | September 2011 |
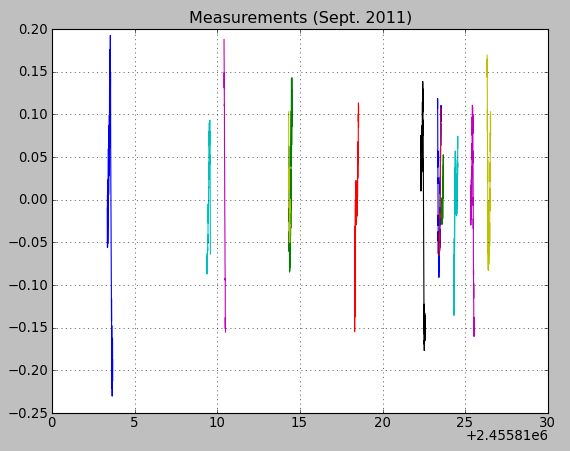
| from / to | 21 June / 13 July | 09 Aug / 01 Sept | 08 Sept / 01 Oct |
| nb of nights | 13 | 7 | 10 |
| nb of Fourier harmonics | 6 | 6 | 6 |
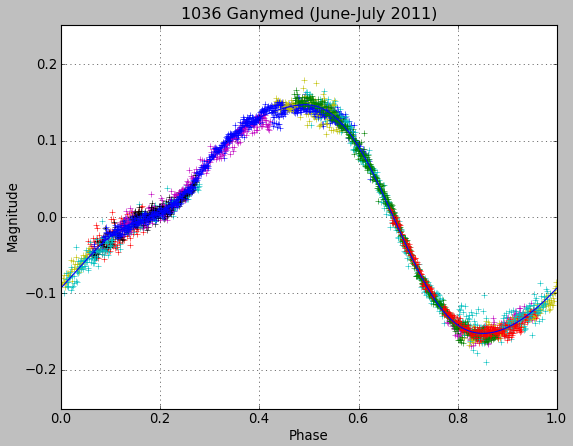
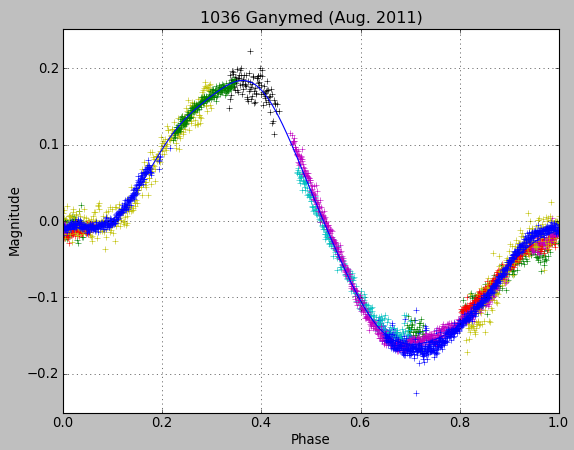
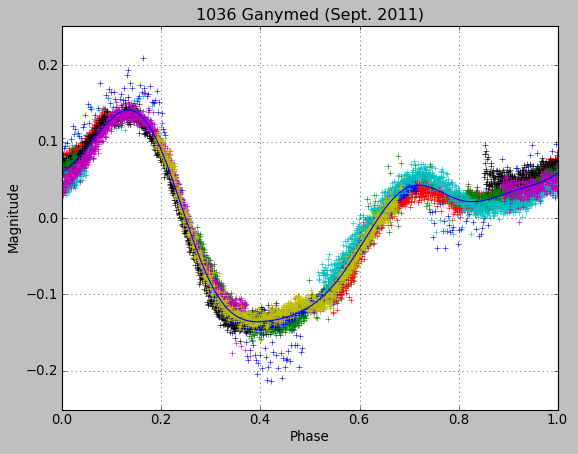
| period (days) | 0.428976 | 0.429330 | 0.429756 |
| 3-sigma uncertainty (days) | 0.000025 | 0.000035 | 0.000024 |
Assumptions:
Results obtained with a Python equivalent of Courbrot software:
- simple script (~150 lines of code) thanks to the routine scipy.optimize.curve_fit which completely manages the least square fitting
- fit with a Fourier series at order 6. Fitting parameters are: period + 12 Fourier coefficients (cos and sin) + magnitude offsets to shift each measurement individually
- copy-paste of MPC ephemeris in a text file to get the distance asteroid / Earth. The propagating time of light is subtracted from the measuring times (small impact)
- scipy.optimize.curve_fit also gives the covariance matrix, the period uncertainty is thus also known (sigma=sqrt(variance))
The uncertainty on the period directly depends on the uncertainty of the magnitude measurements.
The magnitude error is estimated as the quadratic sum of two terms: (1) the rms noise of the obtained magnitude curve, (2) a value of 0.02 that represents all other errors (atmospheric effects, color of reference stars, interfering star when measuring flux, etc). The resulting period uncertainty is then multiplied by 3 to get a 3-sigma value.
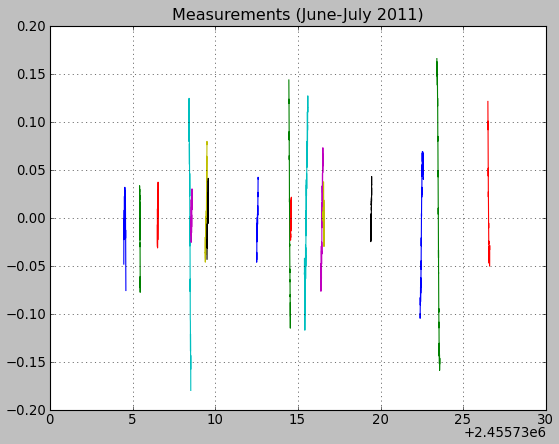
June-July 2011
 |
 |
|
|
|
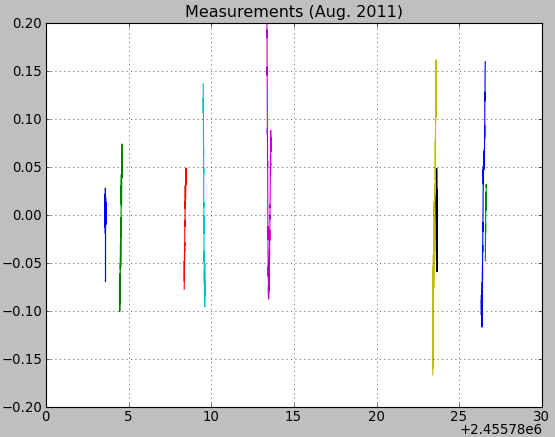
August 2011
 |
 |
|
|
|
September 2011
 |
 |
|
|
|
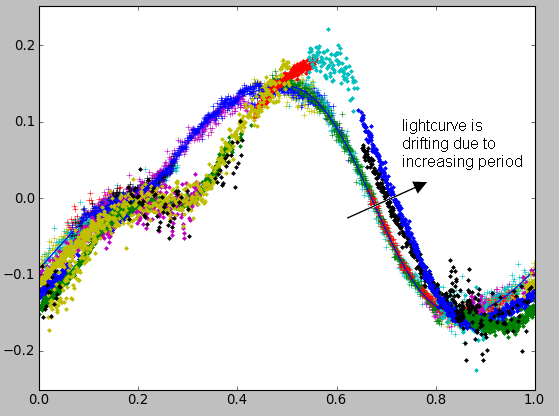
Dephasing (added 05 sept 2011)
If we keep the fit calculated with the June-July measurements, and put the August-September data on it we obtain the figure below. The shift is evident despite the slight change of shape of the lightcurve: as the period gets longer, the same magnitudes occur a bit later than initially expected.